
Chapter 1 / Why Focus on Climate Change?
Why Focus on Climate Change?
Climate change is a significant challenge today. Educators have the potential to inspire decisions, actions, and change. The information in these modules has been crafted to enhance your understanding of the key scientific elements of climate change, and provide resources for you to bring into the classroom to help students understand not only the urgent need for change, but also the opportunity to be part of the transformation toward sustainability.
The purpose of this module is to draw attention to the urgency of the climate change challenge.
Professional Development for Educators
Why Focus on Climate Change?
Climate change is influencing, and being influenced by, all sectors of the apparel and textiles industry from fiber production to disposal or recycling of textile waste products. Professionals in the AT industry have the opportunity to develop new ways of responding to market demands with environmentally-responsible processes and products. Of the many environmental concerns that we face, climate change is among the most urgent because we have set in motion a comprehensive change to the global climate that will impact multiple aspects of the biosphere. We are already observing rising temperatures and sea levels, species adaptation and extinction, and increased frequency and severity of extreme weather events. Together, these will change agriculture, access to potable water, and where and how we live. The driving force of climate change is the production of greenhouse gasses, including carbon dioxide.
The two videos below provide an overview of the issues of climate change.
Climate TRENDS
Scientists have been measuring and recording global temperatures for well over a century. The graphic below from the Intergovernmental Panel on Climate Change (IPCC) shows the observed globally averaged combined land and ocean surface temperature anomaly from 1850 to 2012 from three data sets. [An anomaly is the deviation from what is standard or expected.]
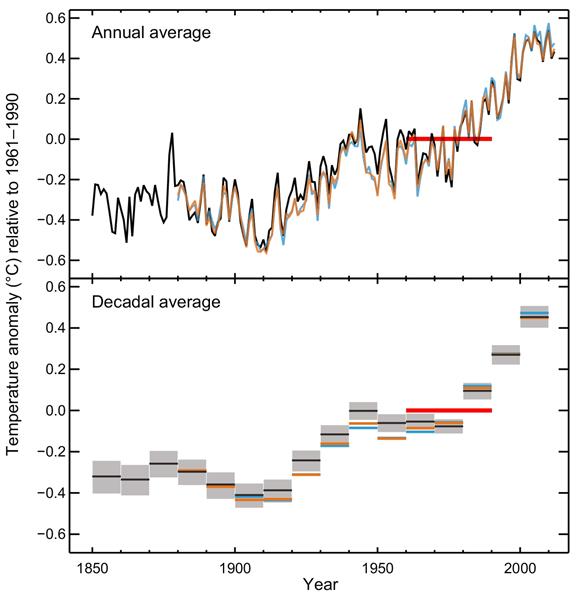
Figure SPM.1: Observed globally averaged combined land and ocean surface temperature anomaly 1850-2012
Graphic Source IPCC, 2013: Summary for Policymakers. In: Climate Change 2013: The Physical Science Basis. Contribution of Working Group I to the Fifth Assessment Report of the Intergovernmental Panel on Climate Change [Stocker, T.F., D. Qin, G.-K. Plattner, M. Tignor, S.K. Allen, J. Boschung, A. Nauels, Y. Xia, V. Bex and P.M. Midgley (eds.)]. Cambridge University Press, Cambridge, United Kingdom and New York, NY, USA. Retrieved from: http://www.climatechange2013.org/images/report/WG1AR5_SPM_FINAL.pdf
This graph uses the average temperature of land and ocean (in Celsius) observed during 1961 to 1990 as the standard - represented by 0.0 on the left side of the graph.
Important elements to consider:
- The chart is based upon observed data, not predictions.
- The standard was calculated during a period of thirty years (highlighted by a red horizontal line added to the graph) and after warming trends were already observed.
- For reference, note that a 0.6 increase or decrease on the Celsius scale is equivalent to a 1.08 increase or decrease on the Fahrenheit scale.
The video below is another way to understand the information provided in the graphic above.
The increase in atmospheric carbon dioxide (CO2) levels described in the video above are illustrated in the chart below. The top chart shows the parts per million (ppm) of atmospheric CO2 from 1958 through 2012. In 2015, we exceeded 400 ppm of atmospheric CO2 as a monthly average.
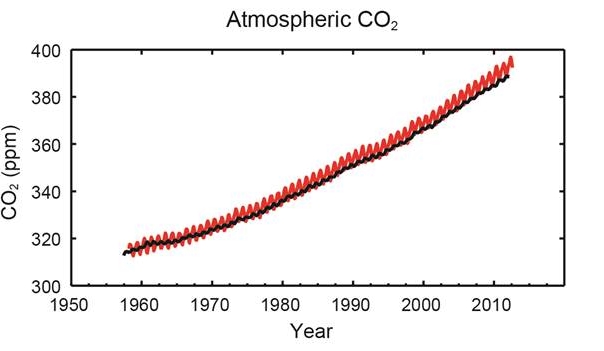
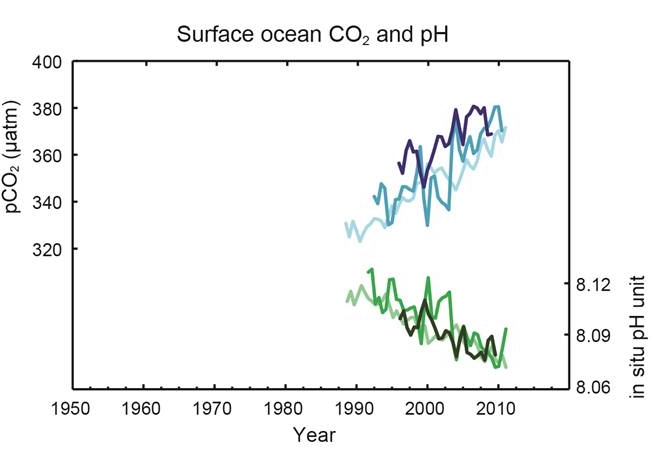
Figure SPM. 4: Multiple observed indicators of a changing global carbon cycle
Graphic Source IPCC, 2013: Summary for Policymakers. In: Climate Change 2013: The Physical Science Basis. Contribution of Working Group I to the Fifth Assessment Report of the Intergovernmental Panel on Climate Change [Stocker, T.F., D. Qin, G.-K. Plattner, M. Tignor, S.K. Allen, J. Boschung, A. Nauels, Y. Xia, V. Bex and P.M. Midgley (eds.)]. Cambridge University Press, Cambridge, United Kingdom and New York, NY, USA.
Retrieved from: http://www.climatechange2013.org/images/report/WG1AR5_SPM_FINAL.pdf
As you can see in the IPCC figure above, in conjunction with the increase in atmospheric carbon dioxide, CO2 absorption levels in the oceans have increased. Approximately one fourth of our total carbon dioxide emissions are absorbed by the oceans. Increased levels of CO2 in seawater lowers pH values of the water resulting in what is known as ocean acidification. This acidification is problematic because acidic ocean water results in fewer carbonate ions available for use by marine organisms (e.g. oysters, clams, corals, plankton) that build skeletons and shells out of calcium carbonate. The changing chemistry of the oceans puts marine ecosystems at risk. (National Oceanic and Atmospheric Administration)
The video below provides a summary of the key issues related to climate change and describes how we can change our future by investing in, and implementing, solutions now.
The video below was produced by The National Academies of Sciences, Engineering, and Medicine. It is subdivided into seven short parts that address key areas of knowledge related to understanding climate change. It may be used as a summary of the issues addressed in this professional development website.
In the Classroom
Why Focus on Climate Change?
The Department of Geosciences at Georgia State University has published a set of labs that may be helpful. Of particular interest is Lab 8 Recent Climate Variability & Change (Part 1) http://sites.gsu.edu/geog1112/lab8-1/
More Information and Resources
Why Focus on Climate Change?
- IPCC, 2013: Summary for Policymakers. In: Climate Change 2013: The Physical Science Basis. Contribution of Working Group I to the Fifth Assessment Report of the Intergovernmental Panel on Climate Change [Stocker, T.F., D. Qin, G.-K. Plattner, M. Tignor, S.K. Allen, J.Boschung, A. Nauels, Y. Xia, V. Bex and P.M. Midgley (eds.)]. Cambridge University Press, Cambridge, United Kingdom and New York, NY, USA
- NASA website on climate science http://climate.nasa.gov/
- A University of British Columbia online course http://www.youtube.com/user/climateliteracy
- Of particular interest related to this section is Module 2.5 Climate Change in the Recent Past http://www.youtube.com/watch?v=-W5wgReG5Vc
- Pacific Institute for Climate Solutions Examples of Global Warming (7:08 minutes) http://www.youtube.com/watch?v=MeBnenUq0Dk
- TED Talk Why I Must Speak Out About Climate Change – James Hansen (17:51 minutes) http://ed.ted.com/lessons/why-i-must-speak-out-about-climate-change-james-hansen
- The New York Times article "Short Answers to Hard Questions About Climate Change" by Justin Gillis, November 28, 2015 http://www.nytimes.com/interactive/2015/11/28/science/what-is-climate-change.html
- The New York Times article "2015 Was Hottest Year in Historical Record, Scientists Say" Justin Gillis, January 20, 2016 http://www.nytimes.com/2016/01/21/science/earth/2015-hottest-year-global-warming.html